Chart.js, Canvas
Charts are far better for displaying data visually than tables and have the added benefit that no one is ever going to press-gang them into use as a layout tool. They’re easier to look at and convey data quickly, but they’re not always easy to create.
A great way to get started with charts is with Chart.js, a JavaScript plugin that uses HTML5’s canvas element to draw the graph onto the page. It’s a well documented plugin that makes using all kinds of bar charts, line charts, pie charts and more, incredibly easy.
-
Setting up
The first thing we need to do is download Chart.js. Copy the Chart.min.js out of the unzipped folder and into the directory you’ll be working in. Then create a new html page and import the script -
Drawing a line
chartTo draw a line chart, the first thing we need to do is create a canvas element in our HTML in which Chart.js can draw our chart. So add this to the body of our HTML page -
Drawing a pie chart Our line chart is complete, so let’s move on to our pie chart. First, we need the canvas element
-
Drawing a bar chart
Finally, let’s add a bar chart to our page. Happily the syntax for the bar chart is very similar to the line chart we’ve already added. First, we add the canvas element

Canvas API
Basic usage of canvas
-
The canvas element At first sight a canvas looks like the img element, with the only clear difference being that it doesn’t have the src and alt attributes. Indeed, the canvas element has only two attributes, width and height.
-
The rendering context The canvas element creates a fixed-size drawing surface that exposes one or more rendering contexts, which are used to create and manipulate the content shown
- Checking for support
The fallback content is displayed in browsers which do not support canvas. Scripts can also check for support programmatically by testing for the presence of the getContext() method. ————————————–Drawing shapes with canvas
- The grid Normally 1 unit in the grid corresponds to 1 pixel on the canvas. The origin of this grid is positioned in the top left corner at coordinate (0,0). All elements are placed relative to this origin. So the position of the top left corner of the blue square becomes x pixels from the left and y pixels from the top, at coordinate (x,y). Later in this tutorial we’ll see how we can translate the origin to a different position, rotate the grid and even scale it, but for now we’ll stick to the default.
More Details how to draw shape in : Drawing shapes with canvas
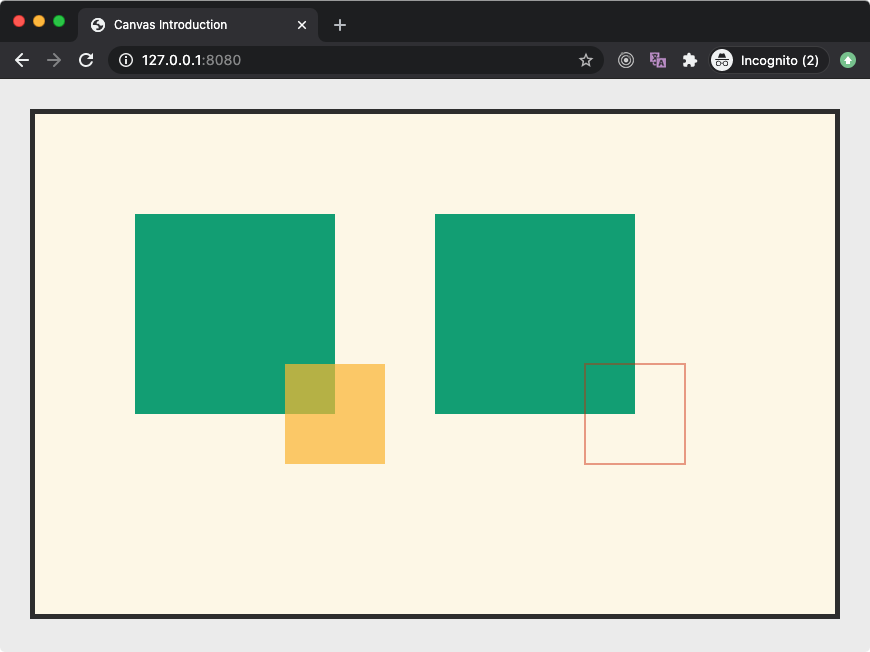
### Applying styles and colors
In the chapter about drawing shapes, we used only the default line and fill styles. Here we will explore the canvas options we have at our disposal to make our drawings a little more attractive. You will learn how to add different colors, line styles, gradients, patterns and shadows to your drawings.
More Details styles and colors: styles and colors canvas api
Drawing text
After having seen how to apply styles and colors in the previous chapter, we will now have a look at how to draw text onto the canvas.
More Details Drawing text: Drawing text canvas api